
Table of Contents
In performance marketing, Cost Per Lead (CPL) has long reigned as the default metric of success. Digital marketing dashboards prominently showcase the metric: "We brought in 600 leads at $4.50 each!"
However, when you attend the month-end revenue meeting with the executive team, the mood is often very different:
- The sales reps were buried in unreachable numbers.
- Half the contacts lacked the budget to purchase.
- Closed deals remained flat despite ad spend doubling.
Optimizing solely for CPL encourages marketing algorithms to locate the cheapest clicks, not the highest-intent buyers. When you focus exclusively on driving down lead costs, ad platforms deliver users who submit forms reflexively without purchasing intent.
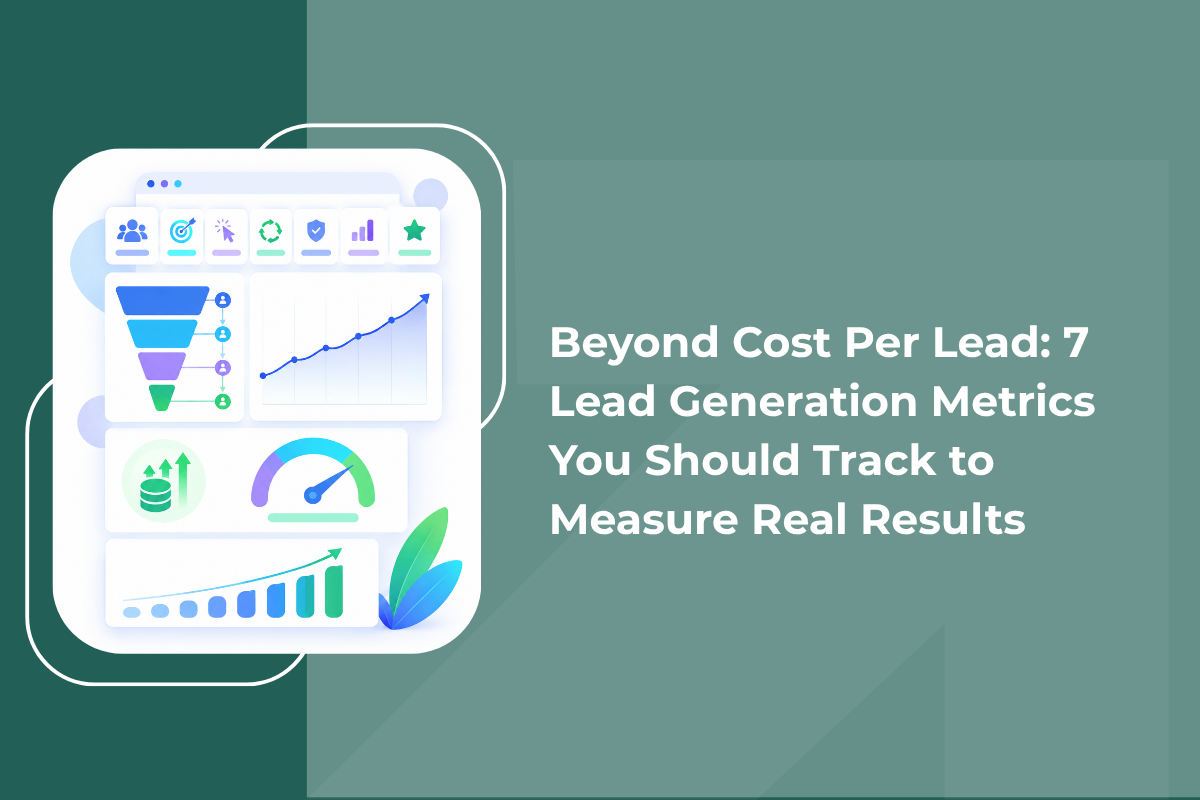
To stop burning ad budgets on vanity metrics and build a predictable growth engine, track these 7 essential lead generation metrics.
1. Cost Per Qualified Lead (CPQL)
While CPL measures what you paid to acquire an email address or phone number, Cost Per Qualified Lead (CPQL) tells you what it costs to obtain someone who matches your Ideal Customer Profile (ICP) and possesses genuine intent.
CPQL= Total Ad Spend / Total Qualified Leads (MQLs/SQLs)
Why it matters:
A campaign generating 100 leads at $10 each ($1,000 spend) with only 5 qualified prospects yields a CPQL of $200. A targeted campaign generating 25 leads at $40 each ($1,000 spend) where 15 are qualified yields a CPQL of $66.67. Even though the second campaign’s initial CPL looks 4x more expensive, it generates three times more pipeline value for the same budget.
Read our complete breakdown on Cost Per Lead vs Cost Per Qualified Lead: Which Metric Should You Actually Optimize?
2. Speed-to-Lead (First Response Time)
Speed-to-Lead measures the time elapsed from when a prospect submits their inquiry to when a sales rep or automated system engages them.
Why it matters:
Lead conversion is time-sensitive. Prospects submitting an ad inquiry often research competitors simultaneously.
- Reaching a lead within 5 minutes increases qualification rates by up to 21x compared to waiting 30 minutes.
- After 1 hour, your chances of qualifying that prospect decrease by over 400%.
If your lead form takes 3 hours to sync to your sales team’s inbox, your ad spend is effectively subsidizing faster competitors.
Stop losing leads in the gap between ads and your sales team.
With GrowEasy, your leads don't wait in a spreadsheet. Automatically engage incoming ad inquiries in real time via WhatsApp, qualify their intent using smart AI workflows, and route hot deals to your reps instantly.
Explore How GrowEasy Automates Lead Response
3. Lead-to-Opportunity Conversion Rate
This metric tracks the percentage of total captured leads that convert into genuine sales opportunities (such as a booked product demo, property site visit, or formal discovery call).
Lead-to-Opportunity Rate=(Total Sales Opportunities/Total Inbound Leads)×100
Why it matters:
This is the primary diagnostic metric for marketing and sales alignment.
- If your lead volume is high but your Lead-to-Opportunity rate is under 5%, your ad messaging is either setting the wrong expectations, attracting unqualified audiences, or suffering from contact data errors.
- Tracking this metric by campaign channel (Facebook vs. Instagram vs. Google) clarifies which channels bring actual prospects rather than passive form-fillers.
4. Lead Contact Rate (Reachability)
How many of your captured leads actually pick up the phone, reply to an email, or answer your message?
Contact Rate=(Leads Reached / EngagedTotal Leads Generated)×100
Why it matters:
If your sales reps make 500 outbound calls but only connect with 75 people, your contact rate is 15%. The remaining 85% of your ad spend is wasted effort.
Low contact rates typically point to:
- Fake numbers submitted on static lead forms.
- Delayed response times (calling hours after the lead has moved on).
- Over-reliance on cold outbound phone calls instead of high-open-rate channels like WhatsApp.
Find out How to Stop Leads From Getting Lost Between Ads, WhatsApp and Your Sales Team.
5. Customer Acquisition Cost (CAC)
Customer Acquisition Cost calculates the full business expense required to convert a single prospect into a paying client.
CAC=Total Marketing Spend+Sales Salaries/Tool Overhead / Number of Customers Acquired
Why it matters:
CPL ignores overhead costs. If your marketing campaign produces $2 leads that take 10 hours of manual sales outreach to close, your actual acquisition cost remains unsustainably high. True efficiency means driving down CAC across the entire funnel, not just front-end ad spend.
Want to lower your Customer Acquisition Cost without hiring an expensive agency?
GrowEasy’s AI Ads Platform creates high-converting ad creative, handles precise targeting, and connects incoming leads directly to streamlined sales pipelines in a single app.
Check GrowEasy Pricing & Launch Your Campaign Today
6. Pipeline Velocity
Pipeline Velocity tracks how quickly a lead navigates your entire sales funnel from initial impression to closed revenue.
V=Number of Opportunities×Win Rate×Average Deal Size / Sales Cycle Length (in Days)
Why it matters:
A shorter sales cycle means cash returns to your business faster, allowing you to reinvest ad dollars without running into working capital issues. Tracking pipeline velocity shows whether your lead generation efforts are attracting decision-makers ready to buy today or early-stage browsers who will stall in your pipeline for 9 months.
7. Return on Ad Spend (ROAS) to Revenue
Ultimately, the metric that supersedes all others is marketing-generated revenue relative to advertising spend.
Revenue ROAS=Actual Revenue Generated from Closed Deals / Total Ad Spend
Why it matters:
It is common for one ad campaign with an expensive $80 CPL to deliver an 8x ROAS, while a "successful" $5 CPL campaign produces zero closed transactions. By attributing closed revenue back to the originating ad creative and channel, you stop starving your most profitable campaigns in favor of cheap vanity metrics.
If your numbers look good but bank deposits are missing, check Getting Leads but No Sales? 10 Reasons Your Lead Generation Campaign Is Failing.
Summary Scorecard: Moving from Vanity to Sanity
To build a high-performing lead generation engine, modernize your weekly marketing scorecard:
| Ditch This Vanity Metric | Replace With This High-Impact Metric |
| Cost Per Lead (CPL) | Cost Per Qualified Lead (CPQL) |
| Total Lead Volume | Lead-to-Opportunity Conversion Rate |
| Ad Click-Through Rate (CTR) | Lead Contact / Engagement Rate |
| Outbound Call Attempts | Speed-to-Lead (First Response Time) |
| Cost Per Click (CPC) | Customer Acquisition Cost (CAC) & ROAS |
Conclusion
Measuring lead generation exclusively by Cost Per Lead is like evaluating a car based solely on how inexpensive its fuel is, without checking whether the engine runs.
By tracking these 7 core metrics, especially CPQL, Speed-to-Lead, and Contact Rate, you illuminate leaks in your funnel, eliminate wasted sales hours, and ensure every dollar deployed on Meta or Google translates into measurable, closed revenue.
Easy and fast setup
Marketing Doesn't Have to Be Hard. Let AI Do the Work.
Start getting leads in 5 minutes – no marketing team needed.
Start Now